This has absolutely nothing to do with my research, but I’ve never liked the way people say that the seasons start on the solstices and equinoxes, with (northern-hemisphere) summer running from June 21-ish through September 21-ish, then autumn on until December 21-ish, etc. I think it’s better to define the seasons this way: summer is June, July and August; autumn is September, October and November; winter is December, January and February; and spring is March, April and May.
My complaint is that the solstice/equinox system doesn’t let summer start until weeks into the heat of June while not letting summer end until well after things have started to cool off in September, it allows plenty of snow to fall before winter begins in late December, etc. I don’t think it makes any sense to say that December 19 is autumn, or that March 19 is winter. I’ve always thought the most defining aspect of summer is “the time when it’s hot” (which is mostly June, July and August), autumn is “the time when it’s cooling off and the leaves are changing” (September through November), winter is “the time when it’s cold and snowy” (that’s mostly December, January and February), and spring is “the time when it’s warming up and plants become green” (March through May). But the solstice/equinox system seems to think the most important aspects of the seasons are “the time when the days are long but getting shorter”, “the time when the days are short and getting shorter still”, “the time when the days are short but getting longer”, and “the time when the days are long and getting even longer”.
In short, I think the most defining quality of each season is the typical temperatures during that season (and everything that comes with that sort of temperature), rather than the length of the day and the sign of the change in that length. And I think those defining temperatures align more with three-month blocks rather than solstice-to-equinox spans (a difference of 3 weeks, or 25% of the length of a season).
And the data agree with me!
NOAA provides climate normals, which tell you, for a given location, the typical temperature on each day of the year. They’re generated by averaging each day’s temperature over the past thirty years. (The ones I used give a typical “average temperature” each day, as opposed to a typical “high” or “low”.) The climate normals generated using temperatures from 1981-2010 are available online. I grabbed that data to see how if aligns with my view of when the seasons should be.
(The data file is products/temperature/dly-tavg-normal.txt in the public FTP server. There are normals for 9,887 weather stations. I filtered out the normals labeled as “quasi-normal” or “provisional”, as well as any normal that didn’t see at least 20 degrees of variation over the year, since those locations don’t have strong, temperature-based seasons. Jupyter notebook here.)
Here are a few plots to get an idea of what those normals can say. Remember that everything is for a “typical” year.

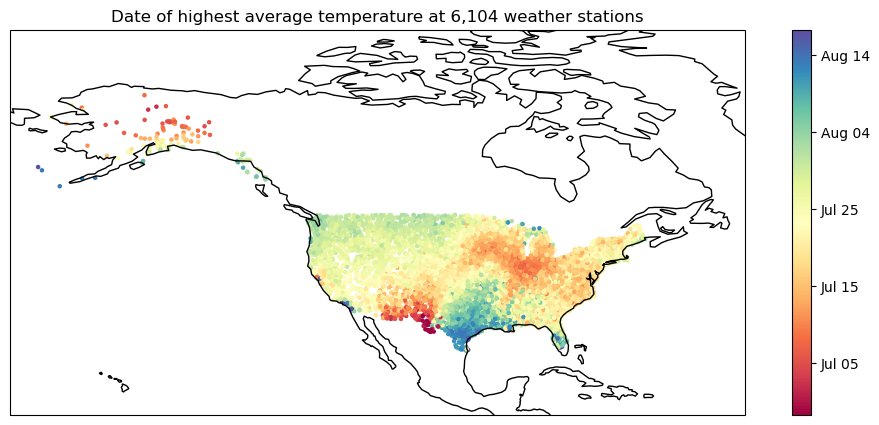

That’s neat, but here’s where it starts to get interesting. This is “temperature over the course of the average year” plotted for all 6,104 weather stations:

The solid white line in the middle marks the average temperature across all weather stations for each day of the year. The individual stations all have their oddities, but the average curve is remarkably smooth!
With that curve, it’s very easy to ask what the coldest and warmest day of the year is, averaged across the entire US. The answers are January 13 and July 23 (a few weeks after the winter solstice, and about a month after the summer solstice). If you agree with me that summer is “when it’s hot” and winter “when it’s cold”, it makes sense to say that January 13 and July 23 are “peak winter” and “peak summer”, and that they ought to be the center of their respective seasons (as opposed to “peak summer” being two days after the solstice-based start of summer!).
If we go on to say that the midpoints of autumn and spring should be halfway between the dates of peak summer and winter, and that the boundaries between seasons should be halfway between the “peak” dates of those seasons, then here are what the seasons should be:
Summer should run from Jun 7 to Sep 2, centered on Jul 23.
Autumn should run from Sep 2 to Nov 29, centered on Oct 16.
Winter should run from Nov 29 to Mar 4, centered on Jan 13.
Spring should run from Mar 4 to Jun 7, centered on Apr 21.
There are two things to note. The first is that this is very close to what I’m saying the seasons should be: I think summer should be June, July and August since summer is “the time when it’s hot”, and based on when it’s hottest, the data say summer should be June 7 to September 2.
A second thing to notice is that, since “peak summer” and “peak winter” aren’t exactly half a year apart, there’s a little unevenness to these definitions. Summer is a little under three months long, winter is a little over three months, etc. I think that’s a good reason to just assign three months to each season—it’s really close to the temperature-based definition, but it evens things out a bit (and is also easier to remember!).
The interesting thing is that NOAA agrees with all this! They label the solstice/equinox definitions as the “astronomical seasons”, since they’re based on the motions of the Earth around the Sun. (But I’m an astronomer and even I don’t like this!) NOAA describes the “meteorological seasons”, on the other hand, as 3-month blocks: March, April and May for spring, June, July and August for summer, and so on. Meteorologists and climatologists have the same idea that summer should be “when it’s hottest”, and for more consistent record-keeping they also want seasons of consistent length as well as consistent start dates (the solstices and equinoxes can move around by a day from year to year).
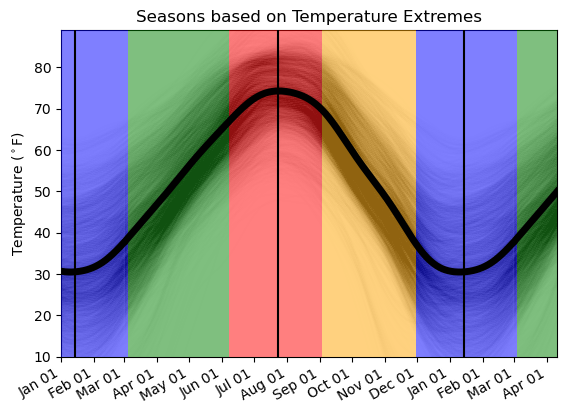
To put this all together, let’s see how the different definitions stack up:

If you, like me, feel like temperatures best define the seasons, that middle band contains the seasons you want. It’s visually clear here how close that definition is to the more even and easier-to-remember 3-month blocks, and it’s also clear that the solstice/equinox definitions are offset from the annual temperature cycles.
Take it from me, an astronomer: don’t use the astronomical definitions of the seasons! Follow the lead of meteorologists and climatologists, the people who pay close attention to what’s happening outside as the seasons change.
Aside: Wikipedia will tell you all about how the traditional boundaries of the seasons vary between countries and cultures—see the opening discussion of autumn, for instance.
Appendix
That’s all using US data, but what if the global picture is different? I couldn’t find climate normals for the whole world, but I did find the Global Historical Climatology Network Daily, which provides 30 GB of daily temperature records for stations across the globe, so I used that to compute my own climate normals.
(I used the contents of ghcnd_all.tar.gz from their FTP server. I used the TAVG data, which should be the same thing that went into the US climate normals. I threw out every station that didn’t have at least 10 years’ worth of data for each day of the year, though I didn’t require it be the same 10 years for each day. Then my normals are just the average of each day’s temperature records. I’m probably skipping some things that the pros do, but I’m no climatology pro.)
This data set includes 115,082 weather stations around the world:

However, most stations don’t have a sufficient quantity of measurements of the daily-average temperature (as opposed to the daily high or low), so I’m limited to only 4,151 stations. They’re almost exclusively in the northern hemisphere, so that’s where I focus.

Now that I have a source of data, here are the same plots as for the US data set:


Summer should run from Jun 7 to Sep 5, centered on Jul 22.
Winter should run from Dec 4 to Mar 6, centered on Jan 19.
Spring should run from Mar 6 to Jun 7, centered on Apr 22.
Autumn should run from Sep 5 to Dec 4, centered on Oct 20.

The global data set doesn’t change much at all. Peak summer is a day earlier, and peak winter 5 days later, and all the other dates have shifted accordingly by a few days. The three-whole-months definition is globally applicable!