
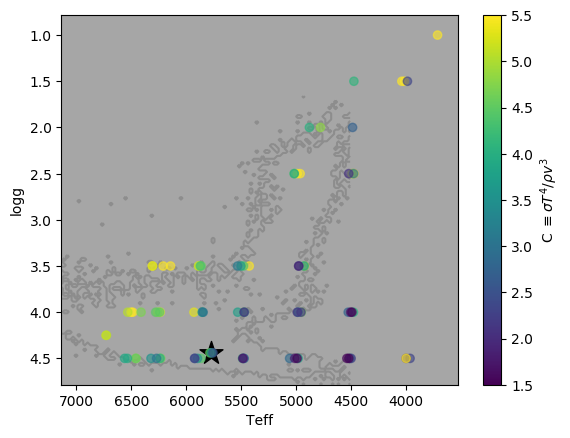
Right now I’m working on a project involving a set of stars, and I very often plot various quantities as a function of two important dimensions (specifically the stars’ surface gravity log g and effective temperature T, which produces something similar to an H-R diagram). Each star is at a fixed location in those two dimensions, so no matter which particular quantity I’m plotting, the landscape of the plot is the same—dwarf stars along the bottom, giant stars in the top-right, the Sun near the bottom-center, and black marking regions of parameter-space that don’t include any stars at all. Over time the outline of this data set—where stars are and where they aren’t—becomes very familiar.

At other times I’m plotting something else but on the same two axes (maybe a different data set, or a fitted function, or something else). Since I’m so familiar with the outline of my main data set, it’s helpful to know where that data lies relative to this other data I’m plotting. Sure, I could just use the tick labels on the axes, but it’s more effective and allows for quicker orientation to draw an outline of the main data set in this other plot, like so:
Here’s the code I’m using to produce this outline. The idea is to produce a 2D histogram of the data set and then make a contour plot of that histogram, drawing a single contour at the 0.5 level so that it separates regions that do have data points from those that don’t. Histogram values greater than 1 are clamped to 1 to ensure the contour line sits consistently at the boundary between histogram bins. (I’ve been using this function for quite a while and honestly can’t remember if I put it together myself or found it on Stack Overflow, so please send me a link if you know of an original source!)
import numpy as np
import matplotlib.pyplot as plt

def outline_data(x, y, **kwargs):
    """Draws an outline of a set of points.

    Accepts two one-dimentional arrays containing the
    x and y coordinates of the data set to be outlined.
    All kwargs are passed to plt.contour"""

    H, x_edge, y_edge = np.histogram2d(x, y, bins=100)
    # H needs to be transposed for plt.contour
    H = H.T

    # Clamp histogram values to 1
    H[H>1] = 1

    # Contour plotting wants the x & y arrays to match the
    # shape of the z array, so work out the middle of each bin
    x_edge = (x_edge[1:] + x_edge[:-1]) / 2
    y_edge = (y_edge[1:] + y_edge[:-1]) / 2
    XX, YY = np.meshgrid(x_edge, y_edge)

    # Fill in some default plot args if not given
    if "alpha" not in kwargs:
        kwargs["alpha"] = 0.5
    if "colors" not in kwargs:
        kwargs["colors"] = "black"
    if "color" in kwargs:
        kwargs["colors"] = kwargs["color"]

    plt.contour(XX, YY, H, levels=[0.5], **kwargs)