The other day I needed to make a plot with dates as the x-axis. Matplotlib supports this, but the examples I was finding weren’t quite as complete as I would have liked. So here’s what I put together as an example.
First, imports. Make sure to get the matplotlib.dates module.
import matplotlib.dates as mdates
import matplotlib.pyplot as plt
from datetime import datetime
We’ll want the date values in the form of datetime objects.
launch_dates = ["2018-07-31", "2018-08-04", "2018-08-06", "2018-08-11"]

def str_to_datetime(strs):
    """Convert a list of "YYYY-MM-DD" strings to datetime objects."""
    dates = []
    for date in strs:
        y, m, d = (int(x) for x in date.split("-"))
        date = datetime(y, m, d)
        dates.append(date)
    return dates

datetimes = str_to_datetime(launch_dates)
Matplotlib uses dates represented as a floating-point “the number of days since a default epoch of 1970-01-01 UTC; for example, 1970-01-01, 06:00 is the floating point number 0.25”, and provides a function for converting datetime instances to this format.
dates = [mdates.date2num(date) for date in datetimes]
These matplotlib-format dates can be plotted like normal numbers (since that’s what they are). To get those numbers formatted as dates, we need to update the locator, which decides where to put tick marks, and the formatter, which formats the tick labels, for the axis containing the dates. Ticks can be set to a number of intervals, from months to microseconds, but the easiest choice is to use the AutoDateLocator and the AutoDateFormatter. Once those are set, the Figure’s autofmt_xdate() method will put the x-axis labels at an angle so they don’t overlap. (This isn’t necessary for y-axis date labels.) Here’s a convenience function to do these things, assuming your dates are on the x-axis.
def x_axis_dates(ax=None, fig=None):
    """Helper function to format the x axis as dates.

    Input:
    ax:  An Axes instance or an iterable of Axes instances.
    Optional, defaults to plt.gca()
    fig: The Figure instance containing those Axes or Axeses
    Optional, defaults to plt.gcf()
    """
    if ax is None: ax = plt.gca()
    if fig is None: fig = plt.gcf()
    loc = mdates.AutoDateLocator()
    fmt = mdates.AutoDateFormatter(loc)
    try:
        ax.xaxis.set_major_locator(loc)
        ax.xaxis.set_major_formatter(fmt)
    except AttributeError:
        for a in ax:
            # Fresh locators/formatters are needed for each instance
            loc = mdates.AutoDateLocator()
            fmt = mdates.AutoDateFormatter(loc)
            a.xaxis.set_major_locator(loc)
            a.xaxis.set_major_formatter(fmt)
    fig.autofmt_xdate()
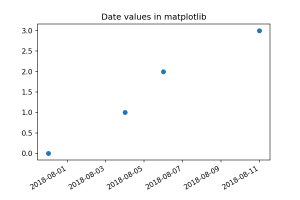
With that function in hand, we can make our plot.
plt.scatter(dates, range(len(dates)))
x_axis_dates()
plt.title("Date values in matplotlib")